Analysis of Export Performance of Leather and Leather Products April-August 2015 vis-à-vis April-August 2014
Introduction:
As per officially notified DGCI&S monthly export data, the export of Leather and Leather products for the period April-August 2015 touched US$ 2653.64 mn as against the performance of US$ 2872.64 mn in the corresponding period of last year (April-August 2014), recording a negative growth of -7.62%. In rupee terms, the export touched Rs. 169367.00 million in April-August 2015 as against the previous year’s performance of Rs. 172557.35 million registering a negative growth of -1.85%.
A Statement showing the Product-wise Export performance during April-August 2015 vis-à-vis April-August 2014 is given below:
| (Value in Million US$) | ||||
|---|---|---|---|---|
| CATEGORY | APRIL-AUG | APRIL-AUG | % VARIATION | % Share |
| 2014 | 2015 | |||
| FINISHED LEATHER | 605.47 | 486.34 | -19.68% | 18.33% |
| LEATHER FOOTWEAR | 1010.22 | 962.75 | -4.70% | 36.28% |
| FOOTWEAR COMPONENTS | 171.61 | 134.68 | -21.52% | 5.08% |
| LEATHER GARMENTS | 264.11 | 260.22 | -1.47% | 9.81% |
| LEATHER GOODS | 606.06 | 590.83 | -2.51% | 22.26% |
| SADDLERY AND HARNESS | 74.07 | 63.35 | -14.47% | 2.39% |
| NON-LEATHER FOOTWEAR | 141.11 | 155.47 | 10.18% | 5.86% |
| TOTAL | 2872.64 | 2653.64 | -7.62% | 100.00% |
| (Value in Million Rs) | |||
|---|---|---|---|
| CATEGORY | APRIL-AUG | APRIL-AUG | % VARIATION |
| 2014 | 2015 | ||
| FINISHED LEATHER | 36369.96 | 31040.15 | -14.65% |
| LEATHER FOOTWEAR | 60682.96 | 61447.04 | 1.26% |
| FOOTWEAR COMPONENTS | 10308.72 | 8595.74 | -16.62% |
| LEATHER GARMENTS | 15864.81 | 16608.66 | 4.69% |
| LEATHER GOODS | 36405.39 | 37709.32 | 3.58% |
| SADDLERY AND HARNESS | 4449.38 | 4043.31 | -9.13% |
| NON-LEATHER FOOTWEAR | 8476.13 | 9922.78 | 17.07% |
| TOTAL | 172557.35 | 169367 | -1.85% |
| Source: DGCI&S | |||
Major Highlights:
- In Rupee Terms, export of leather & leather products have shown positive growth in all the product segments during the period April-August 2015.
- In Dollar Terms, export of leather & leather products have shown positive growth in all the product segments during the period April-August 2015.
Country-wise analysis:
Major export markets are USA 14.35%, U.K. 12.32%, Germany 11.09%, Italy 6.95%, Hong Kong 5.85%, U.A.E. 5.66%, Spain 5.56%, France 4.94%, Netherlands 3.02%, China 2.90%, Vietnam 1.81% and Belgium 1.42%.
These 12 countries together accounts for nearly 75% of India’s total leather& leather products export.
Export of leather & leather products to major markets like Germany, Italy, France, Hong Kong, Russia, Netherlands, Denmark, Greece, Canada, Switzerland, Sweden etc. have shown negative growth during April-August 2015. However, export of leather and leather products to the markets viz., USA, New Zealand, South Africa, Japan, UAE, Korea Rep. etc., has recorded positive growth during the reporting period.
Trend in India’s Export of Leather & Leather Products to different countries during April-August 2015 vis-à-vis April-August 2014 :
| (VALUE IN MILLION US$) | |||||
|---|---|---|---|---|---|
| Share in | Share in | ||||
| COUNTRY | APRIL-AUG | % change | total export | total export | |
| 2014 | 2015 | 2014 | 2015 | ||
| GERMANY | 363.5 | 294.24 | -19.05% | 12.65% | 11.09% |
| U.S.A. | 315.3 | 380.73 | 20.75% | 10.98% | 14.35% |
| U.K. | 321.6 | 326.9 | 1.65% | 11.20% | 12.32% |
| ITALY | 236.15 | 184.3 | -21.95% | 8.22% | 6.95% |
| FRANCE | 170.38 | 131.11 | -23.05% | 5.93% | 4.94% |
| HONG?KONG | 206.87 | 155.26 | -24.95% | 7.20% | 5.85% |
| SPAIN | 149.73 | 147.65 | -1.39% | 5.21% | 5.56% |
| RUSSIA | 21.65 | 17.57 | -18.87% | 0.75% | 0.66% |
| NETHERLANDS | 105.45 | 80.12 | -24.02% | 3.67% | 3.02% |
| AUSTRALIA | 32.94 | 32.71 | -0.68% | 1.15% | 1.23% |
| NEWZEALAND | 4.96 | 5.4 | 8.79% | 0.17% | 0.20% |
| DENMARK | 36.42 | 30.18 | -17.13% | 1.27% | 1.14% |
| GREECE | 6.24 | 4.98 | -20.27% | 0.22% | 0.19% |
| CANADA | 26.28 | 21.61 | -17.75% | 0.91% | 0.81% |
| SWITZERLAND | 16.07 | 14.26 | -11.22% | 0.56% | 0.54% |
| SWEDEN | 22.1 | 17.41 | -21.21% | 0.77% | 0.66% |
| S. AFRICA | 22.2 | 24.56 | 10.66% | 0.77% | 0.93% |
| AUSTRIA | 16.39 | 13.09 | -20.15% | 0.57% | 0.49% |
| BELGIUM | 56.66 | 37.59 | -33.66% | 1.97% | 1.42% |
| JAPAN | 21.33 | 23.12 | 8.39% | 0.74% | 0.87% |
| PORTUGAL | 32.59 | 27.78 | -14.75% | 1.13% | 1.05% |
| CHINA | 87.52 | 76.97 | -12.05% | 3.05% | 2.90% |
| SINGAPORE | 11.85 | 8.58 | -27.60% | 0.41% | 0.32% |
| U.A.E. | 116.92 | 150.15 | 28.42% | 4.07% | 5.66% |
| INDONESIA | 10.6 | 10.71 | 1.07% | 0.37% | 0.40% |
| KOREA REP. | 28.39 | 32.58 | 14.75% | 0.99% | 1.23% |
| VIETNAM | 49.14 | 48.12 | -2.07% | 1.71% | 1.81% |
| SAUDI ARABIA | 19.99 | 17.84 | -10.75% | 0.70% | 0.67% |
| OTHERS | 363.43 | 338.11 | -6.97% | 12.65% | 12.74% |
| TOTAL | 2872.64 | 2653.64 | -7.62% | 100.00% | 100.00% |
| Source : DGCIS | |||||
Port-wise Export Performance:
As per the Port-wise / Region-wise compilation for the period April-August-2015 vis-à-vis April-August 2014, export of leather & leather products from all the Regions have shown positive export trends.
| (Value in Million US$) | |||||
|---|---|---|---|---|---|
| Region | APRIL-AUG | Share in | APRIL-AUG | Share in | % Variation |
| 2014 | Total Export | 2015 | Total Export | ||
| Southern | 862.1 | 30.01% | 764.58 | 28.81% | -11.31% |
| Western | 625.78 | 21.78% | 588.81 | 22.19% | -5.91% |
| Eastern | 351.87 | 12.25% | 308.32 | 11.62% | -12.38% |
| Northern | 324.74 | 11.30% | 320.07 | 12.06% | -1.44% |
| Central | 127.33 | 4.43% | 52.21 | 1.97% | ? -59.00% |
| Others | 580.83 | 20.22% | 619.66 | 23.35% | 6.69% |
| Total | 2872.64 | 100.00% | 2653.64 | 100.00% | -7.62% |
Note: This is purely based on port-wise compilation and does not reflect the accurate regional performance: Source: DGCI& S
Conclusion:
India’s export of leather and leather products decreased to US$ 2653.64 mn as against the performance of US$ 2872.64 mn in the corresponding period of last year, recording a negative growth of -7.62%.
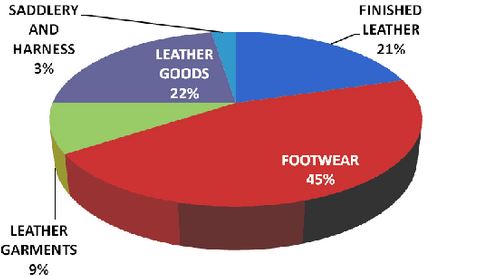
Export of Footwear alone holds a major share of 36.28% in India’s total leather & leather Products exports, followed by Leather Goods & Accessories with a share of 22.26%, finished leather 18.33%, leather garments 9.81%, Non-Leather Footwear 5.86%, Footwear Components 5.08% and saddlery & harness 2.39%.
Chart showing the Product wise Percentage Share in total exports