Analysis of Export Performance of Leather and Leather Products – April-December 2015 vis-à-vis April-December 2014
Introduction:
As per officially notified DGCI&S data, export of leather & leather products for the period April-December 2015 touched US$ 4457.36 mn as against the export of US$ 4990.15 mn in the corresponding period of last year i.e. April-December, 2014, recording a negative growth of -10.68%.
A statement showing export of leather and leather products (both in rupees and dollar terms) from India during April-December 2015 vis-à-vis April-December 2014 is given below:
| (Value in Million Rs) | |||
|---|---|---|---|
| CATEGORY | APR-DEC | APR-DEC | % VARIATION |
| 2014 | 2015 | ||
| FINISHED LEATHER | 63403.86 | 52358.53 | -17.42% |
| LEATHER FOOTWEAR | 104849.89 | 103599.25 | -1.19% |
| FOOTWEAR COMPONENTS | 17449.18 | 14291.42 | -18.10% |
| LEATHER GARMENTS | 28478.24 | 27865.47 | -2.15% |
| LEATHER GOODS | 66900.77 | 67912.58 | 1.51% |
| SADDLERY AND HARNESS | 7663.93 | 7119.94 | -7.10% |
| NON-LEATHER FOOTWEAR | 14549.84 | 15645.31 | 7.53% |
| TOTAL | 303295.71 | 288792.5 | -4.78% |
| Source : DGCI &S | |||
| (�V�a�l�u�e� �i�n� �M�i�l�l�i�o�n� �U�S�$�)� | ||||
|---|---|---|---|---|
| � � � � � � � � � �C�A�T�E�G�O�R�Y� | A�P�R�-�D�E�C� | A�P�R�-�D�E�C� | %� �V�A�R�I�A�T�I�O�N� | %� �S�h�a�r�e� |
| 2014 | 2015 | |||
| F�I�N�I�S�H�E�D� �L�E�A�T�H�E�R� | 1043.19 | 808.13 | -22.53% | 18.13% |
| L�E�A�T�H�E�R� �F�O�O�T�W�E�A�R� | 1725.1 | 1599 | -7.31% | 35.87% |
| F�O�O�T�W�E�A�R� �C�O�M�P�O�N�E�N�T�S� | 287.09 | 220.58 | -23.17% | 4.95% |
| L�E�A�T�H�E�R� �G�A�R�M�E�N�T�S� | 468.55 | 430.09 | -8.21% | 9.65% |
| L�E�A�T�H�E�R� �G�O�O�D�S� | 1100.72 | 1048.2 | -4.77% | 23.52% |
| S�A�D�D�L�E�R�Y� �A�N�D� �H�A�R�N�E�S�S� | 126.1 | 109.89 | -12.85% | 2.47% |
| N�O�N�-�L�E�A�T�H�E�R� �F�O�O�T�W�E�A�R� | 239.39 | 241.48 | 0.87% | 5.42% |
| T�O�T�A�L� | 4990.15 | 4457.36 | -10.68% | 100.00% |
| S�o�u�r�c�e� �:� �D�G�C�I� �&�S� | ||||
- From the above table, it may please be noted that all the leather & leather products (except Non-Leather footwear) have shown decline during the first nine months of the current financial year 2015-16.
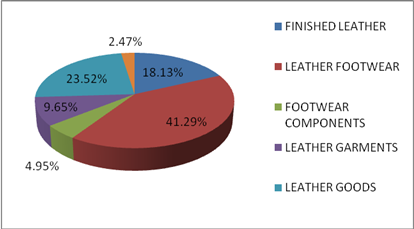
- Footwear holds the major share in exports. The export of different categories of Footwear (leather and non-leather) accounts for 41%. This is followed by Leather Goods accounting for 24%, Finished Leather 18% and Leather Garments 10%.
A Statement showing the Product-wise Export performance (both in rupees & dollar terms) during December, 2014 vis-à-vis December, 2015 is given below:
| (�V�a�l�u�e� �i�n� �M�i�l�l�i�o�n� �R�s�)� | ||||
|---|---|---|---|---|
| � � � � � � � �C�A�T�E�G�O�R�Y� | D�E�C� | D�E�C� | %� �V�A�R�I�A�T�I�O�N� | %� �S�h�a�r�e� |
| 2014 | 2015 | |||
| F�I�N�I�S�H�E�D� �L�E�A�T�H�E�R� | 6382.35 | 5133.25 | -19.57% | 18.13% |
| L�E�A�T�H�E�R� �F�O�O�T�W�E�A�R� | 12846.55 | 12332.52 | -4.00% | 35.87% |
| F�O�O�T�W�E�A�R� �C�O�M�P�O�N�E�N�T�S� | 1743.03 | 1431.93 | -17.85% | 4.95% |
| L�E�A�T�H�E�R� �G�A�R�M�E�N�T�S� | 3674.37 | 3080.83 | -16.15% | 9.65% |
| L�E�A�T�H�E�R� �G�O�O�D�S� | 7572.73 | 7561.28 | -0.15% | 23.52% |
| S�A�D�D�L�E�R�Y� �A�N�D� �H�A�R�N�E�S�S� | 750.13 | 713.35 | -4.90% | 2.47% |
| N�O�N�-�L�E�A�T�H�E�R� �F�O�O�T�W�E�A�R� | 1163.19 | 1207.39 | 3.80% | 5.42% |
| T�O�T�A�L� | 34132.35 | 31460.55 | -7.83% | 100.00% |
| S�o�u�r�c�e� �:� �D�G�C�I� �&�S�,� �C�a�l�c�u�t�t�a� | ||||
| (�V�a�l�u�e� �i�n� �M�i�l�l�i�o�n� �U�S�$�)� | |||||
|---|---|---|---|---|---|
| � � � � � � � � � �C�A�T�E�G�O�R�Y� | D�E�C� | D�E�C� | %� �V�A�R�I�A�T�I�O�N� | ||
| 2014 | 2015 | ||||
| F�I�N�I�S�H�E�D� �L�E�A�T�H�E�R� | 105.01 | 79.23 | -24.55% | ||
| L�E�A�T�H�E�R� �F�O�O�T�W�E�A�R� | 211.37 | 190.35 | -9.94% | ||
| F�O�O�T�W�E�A�R� �C�O�M�P�O�N�E�N�T�S� | 28.68 | 22.1 | -22.93% | ||
| L�E�A�T�H�E�R� �G�A�R�M�E�N�T�S� | 60.45 | 47.55 | -21.34% | ||
| L�E�A�T�H�E�R� �G�O�O�D�S� | 124.59 | 116.7 | -6.33% | ||
| S�A�D�D�L�E�R�Y� �A�N�D� �H�A�R�N�E�S�S� | 12.34 | 11.01 | -10.79% | ||
| N�O�N�-�L�E�A�T�H�E�R� �F�O�O�T�W�E�A�R� | 19.14 | 18.64 | -2.63% | ||
| T�O�T�A�L� | 543.92 | 472.41 | -13.15% | ||
| S�o�u�r�c�e� �:� �D�G�C�I� �&�S�,� �C�a�l�c�u�t�t�a� | |||||
Major Highlights:
- In Rupee Terms,export of leather & leather products has shown an overall negative growth @ -7.83% during the reporting month.
- In Dollar Terms, export of leather & leather products has shown an overall negative growth @ -13.15% in the month of December, 2015 as compared to December, 2014.
Trend in India’s export of Leather & Leather Products to different Countries during April-December 2015 vis-à-vis April-December2014, are given below:
| � � � � � � � � � � � �T�O�T�A�L� | S�h�a�r�e� �i�n� | S�h�a�r�e� �i�n� | |||
|---|---|---|---|---|---|
| C�O�U�N�T�R�Y� | � � � � � � � � � � � � � � � � � � � � � �A�P�R�-�D�E�C� | %� �c�h�a�n�g�e� | � � � �t�o�t�a�l� �e�x�p�o�r�t� | � � � �t�o�t�a�l� �e�x�p�o�r�t� | |
| 2014 | 2015 | 2014 | 2015 | ||
| G�E�R�M�A�N�Y� | 624.7 | 507.28 | -18.80% | 12.52% | 11.38% |
| U�.�S�.�A�.� | 572.18 | 645.49 | 12.81% | 11.47% | 14.48% |
| U�.�K�.� | 574.87 | 553.33 | -3.75% | 11.52% | 12.41% |
| I�T�A�L�Y� | 388.22 | 304.29 | -21.62% | 7.78% | 6.83% |
| F�R�A�N�C�E� | 279.94 | 222.43 | -20.55% | 5.61% | 4.99% |
| H�O�N�G� �K�O�N�G� | 339.52 | 248.65 | -26.76% | 6.80% | 5.58% |
| S�P�A�I�N� | 269.25 | 243.7 | -9.49% | 5.40% | 5.47% |
| R�U�S�S�I�A� | 39.49 | 32.64 | -17.34% | 0.79% | 0.73% |
| N�E�T�H�E�R�L�A�N�D�S� | 173.78 | 140.95 | -18.89% | 3.48% | 3.16% |
| A�U�S�T�R�A�L�I�A� | 61.22 | 61.98 | 1.24% | 1.23% | 1.39% |
| N�E�W�Z�E�A�L�A�N�D� | 8.19 | 8.42 | 2.81% | 0.16% | 0.19% |
| D�E�N�M�A�R�K� | 64.25 | 56.71 | -11.74% | 1.29% | 1.27% |
| G�R�E�E�C�E� | 11.14 | 8.4 | -24.59% | 0.22% | 0.19% |
| C�A�N�A�D�A� | 46.9 | 35.27 | -24.80% | 0.94% | 0.79% |
| S�W�I�T�Z�E�R�L�A�N�D� | 28.76 | 22.32 | -22.41% | 0.58% | 0.50% |
| S�W�E�D�E�N� | 36.38 | 29.19 | -19.77% | 0.73% | 0.65% |
| S�.� �A�F�R�I�C�A� | 37.93 | 40.58 | 6.99% | 0.76% | 0.91% |
| A�U�S�T�R�I�A� | 25.59 | 20.07 | -21.55% | 0.51% | 0.45% |
| B�E�L�G�I�U�M� | 88.74 | 63.44 | -28.51% | 1.78% | 1.42% |
| J�A�P�A�N� | 39.24 | 44.51 | 13.42% | 0.79% | 1.00% |
| P�O�R�T�U�G�A�L� | 53.32 | 44.99 | -15.62% | 1.07% | 1.01% |
| C�H�I�N�A� | 155.81 | 125.92 | -19.18% | 3.12% | 2.82% |
| S�I�N�G�A�P�O�R�E� | 18.37 | 17.35 | -5.58% | 0.37% | 0.39% |
| U�.�A�.�E�.� | 211.49 | 213.22 | 0.82% | 4.24% | 4.78% |
| I�N�D�O�N�E�S�I�A� | 20.1 | 18.97 | -5.62% | 0.40% | 0.43% |
| K�O�R�E�A� �R�E�P�.� | 54.47 | 62.32 | 14.40% | 1.09% | 1.40% |
| V�I�E�T�N�A�M� | 89.53 | 84.56 | -5.55% | 1.79% | 1.90% |
| S�A�U�D�I� �A�R�A�B�I�A� | 34.79 | 25.91 | -25.51% | 0.70% | 0.58% |
| O�T�H�E�R�S� | 642.01 | 574.49 | -10.52% | 12.87% | 12.89% |
| T�O�T�A�L� | 4990.15 | 4457.36 | -10.68% | 100.00% | 100.00% |
Country-wise analysis:
- The major markets for Indian Leather & Leather Products are USA with a share of 14.48%, U.K. 12.41%, Germany 11.38%, Italy 6.83%, Hong Kong 5.58%, Spain 5.47%, France 4.99%, UAE 4.78%, Netherlands 3.16%, China 2.82%, Vietnam 1.90%, Belgium 1.42%, Korea Rep. 1.40%, Australia 1.39%, Denmark 1.27% and Portugal 1.01%.
- These 16 countries together accounts for nearly 80% of India’s total leather& leather products export.
- Export of leather & leather products to the markets like, USA, UAE, New Zealand, South Africa, Japan and Korea Republic have shown positive growth during April-December, 2015.
- Whereas, export to the markets like Germany, Italy, France, Hong Kong, Spain, UK, Russia and Netherlands etc., have declined during the reporting period.
Port-wise Export Performance:
As per the Port-wise / Region-wise compilation for the period April-December 2015 vis-à-vis April-December, 2014, export of leather & leather products from all the Regions are given below:-
| (�V�a�l�u�e� �i�n� �M�i�l�l�i�o�n� �U�S�$�)� | |||||
|---|---|---|---|---|---|
| R�e�g�i�o�n� | A�P�R�-�D�E�C� | S�h�a�r�e� �i�n� � | A�P�R�-�D�E�C� | S�h�a�r�e� �i�n� � | %� �V�a�r�i�a�t�i�o�n� |
| 2014 | T�o�t�a�l� �E�x�p�o�r�t� | 2015 | T�o�t�a�l� �E�x�p�o�r�t� | ||
| S�o�u�t�h�e�r�n� | 1488.75 | 29.83% | 1294.99 | 29.05% | -13.02% |
| W�e�s�t�e�r�n� | 1083.06 | 21.70% | 966.55 | 21.68% | -10.76% |
| E�a�s�t�e�r�n� | 628.21 | 12.59% | 558 | 12.52% | -11.18% |
| N�o�r�t�h�e�r�n� | 600.01 | 12.02% | 533.14 | 11.96% | -11.15% |
| C�e�n�t�r�a�l� | 192.39 | 3.86% | 88.01 | 1.97% | -54.26% |
| O�t�h�e�r�s� | 997.73 | 19.99% | 1016.67 | 22.81% | 1.90% |
| T�o�t�a�l� | 4990.15 | 100.00% | 4457.36 | 100.00% | -10.68% |
| S�o�u�r�c�e� �:� �D�G�C�I� �&�S�,� �C�a�l�c�u�t�t�a� | |||||
Note: This is purely based on port-wise compilation and does not reflect the accurate regional performance: Source: DGCI& S
Conclusion:
India’s export of leather & leather products for the period April-December, 2015 touched US$ 4457.36 mn as against the export of US$ 4990.15 mn in the corresponding period of last year i.e. April-December, 2014, recording a negative growth of -10.68%.
Export of different categories of Footwear (leather and non-leather) holds the major share in exports. The export of different categories of Footwear accounts for 41%. This is followed by Leather Goods accounting for 24%, Finished Leather 18% and Leather Garments 10%.
Chart showing the Product wise Percentage Share in total exports