Analysis of Export Performance of Leather and Leather Products April-March 2014-15 vis-à-vis April-March 2013-14
1.0 Introduction:
As per officially notified DGCI&S monthly export data, the export of Leather and Leather products for the financial year April-March 2014-15 touched US$ 6494.41 mn as against the performance of US$ 5937.97 mn in the corresponding period of last year, recording a positive growth of 9.37%. In Rupee terms, the export touched Rs. 397091.55 mn in April-March 2014-15 as against the previous year’s performance of Rs. 359246.15 mn registering a positive growth of 10.53%.
A Statement showing the Product-wise Export performance during April-January 2015 vis-à-vis April-January 2014 is given below:
| (Value in Million US$) | ||||
| CATEGORY | APRIL-MAR | APRIL-MAR | % VARIATION | % Share |
| 2013-14 | 2014-15 | |||
| FINISHED LEATHER | 1284.71 | 1329.05 | 3.45% | 20.46% |
| LEATHER FOOTWEAR | 2035.45 | 2277.52 | 11.89% | 35.07% |
| FOOTWEAR COMPONENTS | 320.15 | 361.21 | 12.82% | 5.56% |
| LEATHER GARMENTS | 596.15 | 604.25 | 1.36% | 9.30% |
| LEATHER GOODS | 1353.91 | 1453.26 | 7.34% | 22.38% |
| SADDLERY AND HARNESS | 145.54 | 162.70 | 11.80% | 2.51% |
| NON-LEATHER FOOTWEAR | 202.06 | 306.42 | 51.65% | 4.72% |
| TOTAL | 5937.97 | 6494.41 | 9.37% | 100.00% |
| (Value in Million Rs) | |||
| CATEGORY | APRIL-MAR | APRIL-MAR | % VARIATION |
| 2013-14 | 2014-15 | ||
| FINISHED LEATHER | 77724.70 | 81262.67 | 4.55% |
| LEATHER FOOTWEAR | 123144.36 | 139255.74 | 13.08% |
| FOOTWEAR COMPONENTS | 19369.28 | 22085.68 | 14.02% |
| LEATHER GARMENTS | 36067.17 | 36945.77 | 2.44% |
| LEATHER GOODS | 81911.00 | 88857.54 | 8.48% |
| SADDLERY AND HARNESS | 8804.99 | 9948.29 | 12.98% |
| NON-LEATHER FOOTWEAR | 12224.65 | 18735.86 | 53.26% |
| TOTAL | 359246.15 | 397091.55 | 10.53% |
| Source: DGCI&S | |||
1.1 Major Highlights:
In Rupee Terms, export of leather & leather products have shown positive growth in all the product segments during the period April-March 2014-15.
In Dollar Terms, export of leather & leather products have shown positive growth in all the product segments during the period April-March 2014-15.
2.0 Country-wise analysis
The major markets for Indian Leather & Leather Products are Germany with a share of 12.32%, USA 11.83%, U.K. 11.57%, Italy 7.76%, France 5.72%, Hong Kong 6.50%, Spain 5.41%, Netherlands 3.46%, China 2.99%, Denmark 1.29%, UAE 4.3%, Belgium 1.68%,
These 12 countries together accounts for nearly 75% of India’s total leather& leather products export.
Export of leather & leather products to major markets like Germany, USA, UK, France, Spain, Canada, S. Africa, Japan, Portugal, UAE, China, Belgium have shown positive growth during April-March 2013-14.
Trend in India’s Export of Leather & Leather Products to different countries during April-March 2014-15 vis-à-vis April-March 2013-14:
| (VALUE IN MILLION US$) | ||||
| TOTAL | Share in | |||
| COUNTRY | APRIL-MAR | % change | total export | |
| 2013-14 | 2014-15 | 2014-15 | ||
| GERMANY | 765.56 | 800.20 | 4.52% | 12.32% |
| U.S.A. | 680.22 | 768.06 | 12.91% | 11.83% |
| U.K. | 664.92 | 751.33 | 13.00% | 11.57% |
| ITALY | 518.04 | 504.26 | -2.66% | 7.76% |
| FRANCE | 354.72 | 371.75 | 4.80% | 5.72% |
| HONG KONG | 471.61 | 422.11 | -10.50% | 6.50% |
| SPAIN | 308.07 | 351.27 | 14.02% | 5.41% |
| RUSSIA | 51.58 | 49.96 | -3.14% | 0.77% |
| NETHERLANDS | 218.55 | 224.92 | 2.92% | 3.46% |
| AUSTRALIA | 78.73 | 84.66 | 7.53% | 1.30% |
| NEWZEALAND | 9.66 | 12.11 | 25.38% | 0.19% |
| DENMARK | 89.38 | 83.90 | -6.12% | 1.29% |
| GREECE | 12.01 | 14.22 | 18.40% | 0.22% |
| CANADA | 51.66 | 59.24 | 14.69% | 0.91% |
| SWITZERLAND | 32.82 | 37.05 | 12.89% | 0.57% |
| SWEDEN | 50.62 | 46.48 | -8.18% | 0.72% |
| S. AFRICA | 48.16 | 55.04 | 14.28% | 0.85% |
| AUSTRIA | 40.06 | 35.48 | -11.44% | 0.55% |
| BELGIUM | 95.73 | 108.88 | 13.74% | 1.68% |
| JAPAN | 48.76 | 56.21 | 15.28% | 0.87% |
| PORTUGAL | 51.84 | 68.39 | 31.93% | 1.05% |
| CHINA | 153.63 | 194.26 | 26.45% | 2.99% |
| SINGAPORE | 19.77 | 22.14 | 11.97% | 0.34% |
| U.A.E. | 180.54 | 281.07 | 55.68% | 4.33% |
| INDONESIA | 27.22 | 28.95 | 6.37% | 0.45% |
| KOREA REP. | 58.30 | 68.47 | 17.46% | 1.05% |
| VIETNAM | 86.34 | 115.57 | 33.86% | 1.78% |
| SAUDI ARABIA | 38.67 | 47.42 | 19.11% | 0.73% |
| OTHERS | 730.82 | 831.01 | 13.71% | 12.79% |
| TOTAL | 5937.97 | 6494.41 | 9.37% | 100.00% |
| Source : DGCIS | ||||
3.0 Port-wise Export Performance
As per the Port-wise / Region-wise compilation for the period April-March 2014-15 vis-à-vis April-March 2013-14, export of leather & leather products from all the Regions have shown positive export trends.
| (Value in Million US$) | |||||
| Region | APRIL-MAR | Share in | APRIL-MAR | Share in | % Variation |
| 2013-14 | Total Export | 2014 | Total Export | ||
| Southern | 1766.04 | 29.74% | 1902.39 | 29.29% | 7.72% |
| Western | 1328.39 | 22.37% | 1457.95 | 22.45% | 9.75% |
| Eastern | 806.13 | 13.58% | 831.03 | 12.80% | 3.09% |
| Northern | 736.01 | 12.40% | 778.81 | 11.99% | 5.81% |
| Central | 209.56 | 3.53% | 220.27 | 3.39% | 5.11% |
| Others | 1091.84 | 18.39% | 1303.97 | 20.08% | 19.43% |
| Total | 5937.97 | 100.00% | 6494.41 | 100.00% | 9.37% |
Note: This is purely based on port-wise compilation and does not reflect the accurate regional performance: Source: DGCI& S
4.0 Conclusion:
India’s export of Leather and Leather products for the financial year April-March 2014-15 touched US$ 6494.41 mn as against the performance of US$ 5937.97 mn in the corresponding period of last year, recording a positive growth of 9.37%.
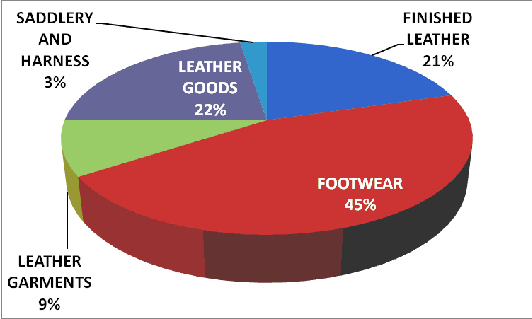
Export of different categories of Footwear holds a major share of about 45% in India’s total leather & leather Products exports with an export value of US$ 2945.15 mn. This is followed by Leather Goods & Accessories with a share of 22%, Finished Leather 21%, Leather Garments 9% and Saddlery & Harness 3%.
Chart showing the Product wise Percentage Share in total exports