INDIAN LEATHER INDUSTRY
COUNCIL FOR LEATHER EXPORTS
INDIAN LEATHER INDUSTRY – OVERVIEW, EXPORT PERFORMANCE & PROSPECTS
- The Indian Leather, Leather Products and Footwear Industry holds a prominent place in the Indian economy. This sector is known for its consistency in high export earnings and it is among the top ten foreign exchange earners for the Country.
- The export of footwear, leather and leather products from India was to the tune of US $ 3.68 billion during 2020-21.
- The industry is bestowed with an affluence of raw materials as India is endowed with 20% of world cattle & buffalo and 11% of world goat & sheep population. Added to this are the strengths of skilled manpower, innovative technology, increasing industry compliance to international environmental standards, and the dedicated support of the allied industries.
- The leather industry is an employment intensive sector, providing job to about 4.42 million people, mostly from the weaker sections of the society. Women employment is predominant in leather products sector with about 30% share.
- India is the second largest exporter of leather garments, third largest exporter of Saddlery & Harness and 4th largest exporter of Leather Goods in the world.
- The major production centers for footwear, leather and leather products in India are located in the States of Tamil Nadu – Chennai, Ambur, Ranipet, Vaniyambadi, Vellore, Pernambut, Trichy, Dindigul and Erode; West Bengal – Kolkata; Uttar Pradesh – Kanpur, Agra, Noida, Saharanpur; Maharashtra – Mumbai; Punjab – Jalandhar; Karnataka – Bengaluru; Telengana Hyderabad; Haryana – Ambala, Gurgaon, Panchkula, Karnal and Faridabad; Delhi; Madhya Pradesh – Dewas; Kerala – Kozhikode and Ernakulam / Cochin; Rajasthan; Jaipur; Jammu & Kashmir; Srinagar.
Strengths of Indian leather sector
- Own raw material source – About 3 billion sq ft of leather produced annually
- Some varieties of goat / calf / sheep skins command premium position
- Strong and eco-sustainable tanning base
- Modernized manufacturing units
- Trained / skilled manpower at competitive wage levels
- World-class institutional support for Design & Product Development, HRD and R & D.
- Presence of support industries like leather chemicals and finishing auxiliaries
- Presence in major markets – Long Europe experience
- Strategic location in the Asian landmass
Emerging strengths
- Design development initiatives by institutions and individuals
- Continuous modernization and technology up-gradation
- Economic size of manufacturing units
- Constant human resource development programme to enhance productivity
- Increasing use of quality components
- Shorter prototype development time
- Delivery compliance
- Growing domestic market for footwear and leather articles
Highlights of Product Segments of Indian Leather and Footwear Industry
- Tanning Sector – Annual availability of leathers in India is about 3 billion sq.ft. India accounts for 13% of world leather production of leathers. Indian leather trends/colors are continuously being selected at the MODEUROPE Congress
- Footwear Sector – India is Second largest footwear producer after China, with Annual Production of 2.58 billion pairs (2018). India is also the second largest consumer of footwear after China, with a consumption of 2.60 billion pairs.
Footwear (leather and non-leather) export accounts for about 45.62% share in Indian leather and footwear industry’s export (2020-21).
- Leather Garments Sector – India is the second largest global exporter.
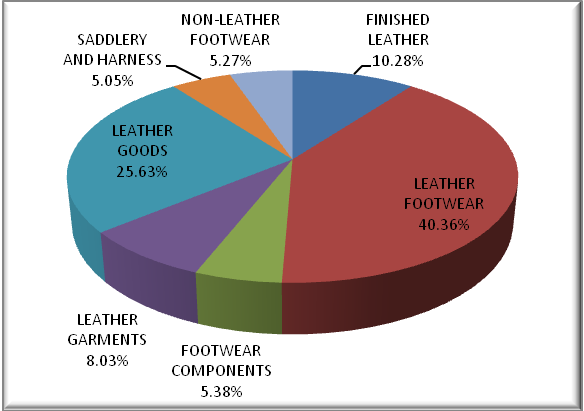
Accounts for 8.03% share of India’s total export from leather sector (2020-21).
- Leather Goods & Accessories Sector including Saddlery & Harness – India is the fifth largest global exporter of Leather Goods & Accessories and third largest exporter of Sadldery and Harness items.
INDIA’S EXPORT OF LEATHER & LEATHER PRODUCTS 2019-20 vis-a-vis 2020-21
Value in US$ Mn
| CATEGORY | APR – MAR | APR – MAR | % VARIATION | % Share |
| 2019-2020 | 2020-2021 | 2021 | ||
| FINISHED LEATHER | 524.15 | 378.23 | -27.84% | 10.27% |
| LEATHER FOOTWEAR | 2081.67 | 1485.55 | -28.64% | 40.35% |
| FOOTWEAR COMPONENTS | 261.67 | 197.59 | -24.49% | 5.37% |
| LEATHER GARMENTS | 429.11 | 295.56 | -31.12% | 8.03% |
| LEATHER GOODS | 1353.74 | 944.31 | -30.24% | 25.65% |
| SADDLERY AND HARNESS | 151.44 | 186.18 | 22.94% | 5.06% |
| NON-LEATHER FOOTWEAR | 281.97 | 194.16 | -31.14% | 5.27% |
| TOTAL | 5083.76 | 3681.58 | -27.58% | 100.00% |
Source : DGCI & S
% SHARE OF LEATHER & LEATHER PRODUCTS FY 2020-21

Major Markets:
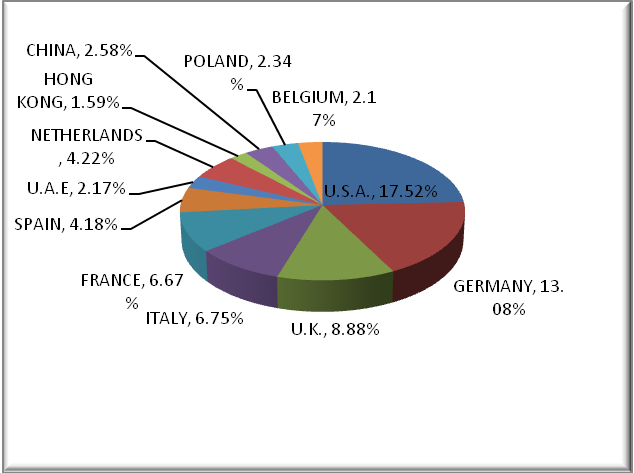
- The major markets for Indian Leather & Leather Products are USA with a share of 17.52%, Germany 13.08%, U.K 8.88%, Italy 6.75%, France 6.67%, Spain 4.18%, Netherlands 4.22%, U.A.E 2.17%, China 2.58%, Poland 2.34%, Belgium 2.17% and Australia 2.04%
- The Top 12 countries together accounts for nearly 72.15% of India’s total leather & leather products export.
% SHARE OF INDIA’S EXPORTS OF LEATHER & LEATHER PRODUCTS
IN TOP 12 COUNTRIES IN US $ MN FY 2020-21

INDIA’S EXPORT OF LEATHER & LEATHER PRODUCTS TO VARIOUS COUNTRIES FOR LAST 5 YEARS.
(Value in million USD)
| COUNTRY | 2016-17 | 2017-18 | 2018-19 | 2019-20 | 2020-21 | %Share of 2020-21 |
| USA | 867.19 | 847.30 | 893.68 | 873.29 | 645.03 | 17.52% |
| Germany | 657.37 | 684.41 | 659.18 | 607.44 | 481.44 | 13.08% |
| UK | 606.18 | 616.41 | 597.30 | 528.84 | 326.98 | 8.88% |
| Italy | 374.09 | 389.06 | 368.71 | 320.75 | 248.6 | 6.75% |
| France | 287.74 | 326.38 | 323.02 | 301.07 | 245.42 | 6.67% |
| Spain | 293.43 | 281.30 | 258.26 | 254.13 | 154.06 | 4.18% |
| U.A.E. | 226.72 | 161.27 | 226.18 | 169.86 | 80.05 | 2.17% |
| Netherlands | 169.00 | 196.98 | 194.43 | 178.68 | 155.42 | 4.22% |
| Hong Kong | 265.60 | 248.07 | 190.31 | 109.16 | 58.48 | 1.59% |
| China | 173.72 | 170.34 | 148.21 | 132.12 | 95.15 | 2.58% |
| Poland | 101.06 | 144.47 | 115.02 | 106.78 | 86.26 | 2.34% |
| Belgium | 104.90 | 114.80 | 114.09 | 112.16 | 80.02 | 2.17% |
| Somalia | 94.12 | 58.82 | 102.24 | 57.94 | 42.42 | 1.15% |
| Vietnam | 92.38 | 104.81 | 98.44 | 82.48 | 53.33 | 1.45% |
| Australia | 82.66 | 91.16 | 95.36 | 85.15 | 74.95 | 2.04% |
| Portugal | 67.61 | 68.62 | 68.77 | 58.38 | 44.45 | 1.21% |
| Denmark | 77.22 | 69.35 | 67.39 | 68.36 | 61.24 | 1.66% |
| Korea Rep. | 68.65 | 67.22 | 66.12 | 57.32 | 35.91 | 0.98% |
| Japan | 63.87 | 71.42 | 65.53 | 59.48 | 45.69 | 1.24% |
| Russia | 51.15 | 56.08 | 52.59 | 46.58 | 39.28 | 1.07% |
| South Africa | 44.13 | 43.80 | 52.28 | 44.68 | 26.17 | 0.71% |
| Chile | 41.85 | 44.90 | 48.87 | 39.97 | 31.92 | 0.87% |
| Malaysia | 48.60 | 48.77 | 46.32 | 33.67 | 32.4 | 0.88% |
| Austria | 27.86 | 46.26 | 43.82 | 46.00 | 27.72 | 0.75% |
| Canada | 46.94 | 50.50 | 43.27 | 47.06 | 35.81 | 0.97% |
| Sweden | 40.83 | 43.20 | 40.02 | 34.54 | 28.1 | 0.76% |
| Nigeria | 20.29 | 24.75 | 37.53 | 19.26 | 12.79 | 0.35% |
| Indonesia | 26.97 | 33.82 | 37.23 | 34.35 | 17.94 | 0.49% |
| Mexico | 12.14 | 19.36 | 36.07 | 29.68 | 17.69 | 0.48% |
| Saudi Arabia | 40.86 | 37.87 | 33.65 | 38.96 | 23.23 | 0.63% |
| Kenya | 30.25 | 22.04 | 32.29 | 16.38 | 11.52 | 0.31% |
| Switzerland | 24.83 | 30.37 | 31.41 | 37.17 | 29.5 | 0.80% |
| Slovak rep | 31.48 | 36.44 | 26.61 | 20.29 | 14.48 | 0.39% |
| Hungary | 28.23 | 24.65 | 24.31 | 20.04 | 20.9 | 0.57% |
| Thailand | 19.82 | 19.82 | 20.20 | 16.99 | 14.92 | 0.41% |
| Bangladesh | 34.98 | 27.59 | 19.84 | 20.42 | 13.51 | 0.37% |
| Finland | 17.25 | 19.76 | 18.64 | 16.32 | 11.66 | 0.32% |
| Turkey | 19.96 | 22.63 | 16.31 | 11.30 | 11.85 | 0.32% |
| Israel | 13.24 | 15.87 | 15.86 | 17.13 | 13.46 | 0.37% |
| Cambodia | 10.37 | 7.27 | 10.84 | 9.07 | 4.7 | 0.13% |
| Czech Republic | 9.34 | 11.91 | 10.52 | 11.48 | 8.35 | 0.23% |
| Greece | 10.16 | 10.28 | 10.46 | 9.61 | 8.25 | 0.22% |
| New Zealand | 9.82 | 9.88 | 10.16 | 8.88 | 8.6 | 0.23% |
| Oman | 12.29 | 9.32 | 9.46 | 7.46 | 6.68 | 0.18% |
| Sri Lanka Des | 14.42 | 12.34 | 9.39 | 8.60 | 4.57 | 0.12% |
| Singapore | 33.04 | 14.42 | 9.22 | 8.71 | 4.59 | 0.12% |
| Sudan | 14.63 | 8.86 | 9.10 | 14.11 | 11 | 0.30% |
| Taiwan | 8.97 | 8.07 | 8.44 | 5.84 | 4.38 | 0.12% |
| Norway | 7.54 | 8.76 | 6.32 | 6.77 | 6.49 | 0.18% |
| Djibouti | 11.19 | 8.56 | 6.28 | 3.94 | 3.13 | 0.09% |
| Others | 209.98 | 249.40 | 261.02 | 221.90 | 161.09 | 4.38% |
| Total | 5646.80 | 5740.97 | 5691.00 | 5070.55 | 3681.58 | 100.00% |
| Source: DGCI&S |
FUTURE OUTLOOK:-
The Government of India had identified the Leather & Footwear Sector as one of the 12 Focus Sectors where India can be a Global Supplier. With the implementation of various industrial developmental programmes as well as export promotional activities; and keeping in view the past performance, and industry’s inherent strengths of skilled manpower, innovative technology, increasing industry compliance to international environmental standards, and dedicated support of the allied industries, the Indian leather industry aims to augment the production, thereby enhance export, and resultantly create additional employment opportunities.
