Analysis of Export Performance of Leather and Leather Products April-November 2014 vis-à-vis April-November 2013
1.0 Introduction:
As per officially notified DGCI&S monthly export data, the export of Leather and Leather products for the financial year April-November 2014 touched US$ 4450.61 mn as against the performance of US$ 3797.98 mn in the corresponding period of last year, recording a positive growth of 17.18%. In rupee terms, the export touched Rs. 269405.23 million in April-November 2014 as against the previous year’s performance of Rs. 227294.23 million registering a positive growth of 18.53%.
A Statement showing the Product-wise Export performance during April-November 2014 vis-à-vis April-November 2013 is given below:\
| (Value in Million US$) | ||||
| CATEGORY | APRIL-NOV | APRIL-NOV | % VARIATION | % Share |
| 2013 | 2014 | |||
| FINISHED LEATHER | 852.02 | 942.02 | 10.56% | 21.17% |
| LEATHER FOOTWEAR | 1254.53 | 1526.60 | 21.69% | 34.30% |
| FOOTWEAR COMPONENTS | 210.77 | 259.68 | 23.21% | 5.83% |
| LEATHER GARMENTS | 386.66 | 409.78 | 5.98% | 9.21% |
| LEATHER GOODS | 880.05 | 977.33 | 11.05% | 21.96% |
| SADDLERY AND HARNESS | 94.65 | 114.22 | 20.67% | 2.57% |
| NON-LEATHER FOOTWEAR | 119.31 | 221.00 | 85.24% | 4.97% |
| TOTAL | 3797.98 | 4450.61 | 17.18% | 100.00% |
| (Value in Million Rs) | |||
| CATEGORY | APRIL-NOV | APRIL-NOV | % VARIATION |
| 2013 | 2014 | ||
| FINISHED LEATHER | 50990.17 | 57022.45 | 11.83% |
| LEATHER FOOTWEAR | 75078.75 | 92408.49 | 23.08% |
| FOOTWEAR COMPONENTS | 12613.47 | 15718.76 | 24.62% |
| LEATHER GARMENTS | 23139.83 | 24804.65 | 7.19% |
| LEATHER GOODS | 52667.57 | 59159.69 | 12.33% |
| SADDLERY AND HARNESS | 5664.47 | 6913.79 | 22.06% |
| NON-LEATHER FOOTWEAR | 7139.97 | 13377.40 | 87.36% |
| TOTAL | 227294.23 | 269405.23 | 18.53% |
| Source: DGCI&S | |||
1.1 Major Highlights:
In Rupee Terms, export of leather & leather products have shown positive growth in all the product segments during the period April-November 2014.
In Dollar Terms, export of leather & leather products have shown positive growth in all the product segments during the period April-November 2014.
2.0 Country-wise analysis
The major markets for Indian Leather & Leather Products are Germany with a share of 12.39%, U.K. 11.68%, USA 11.50%, Italy 8.77%, Hong Kong 5.34%, France 6.39%, Spain 5.42%, Netherlands 3.79%, China 2.48%, Denmark 1.27%, UAE.2.53%, Belgium 1.86%,
These 12 countries together accounts for nearly 73% of India’s total leather& leather products export.
Export of leather & leather products to major markets like Germany, USA, UK, Italy, France, Russia, Netherlands, Canada, S. Africa, Japan, Portugal, UAE, China have shown positive growth during April-Nov 2014.
Trend in India’s Export of Leather & Leather Products to different countries during April-Nov 2014 vis-à-vis April-Nov 2013 :
| (VALUE IN MILLION US$) | ||||
| TOTAL | Share in | |||
| COUNTRY | APRIL-NOV | % change | total export | |
| 2014 | 2013 | 2014 | ||
| GERMANY | 476.96 | 551.24 | 15.57% | 12.39% |
| U.S.A. | 431.05 | 511.74 | 18.72% | 11.50% |
| U.K. | 431.68 | 519.84 | 20.42% | 11.68% |
| ITALY | 331.73 | 349.60 | 5.39% | 8.77% |
| FRANCE | 216.84 | 242.72 | 11.93% | 6.39% |
| HONG KONG | 329.66 | 310.68 | -5.76% | 5.34% |
| SPAIN | 193.97 | 241.07 | 24.28% | 5.42% |
| RUSSIA | 30.84 | 32.74 | 6.15% | 0.74% |
| NETHERLANDS | 138.16 | 154.21 | 11.61% | 3.79% |
| AUSTRALIA | 49.37 | 53.95 | 9.26% | 1.21% |
| NEWZEALAND | 5.70 | 7.38 | 29.29% | 0.17% |
| DENMARK | 57.04 | 56.32 | -1.26% | 1.27% |
| GREECE | 7.32 | 9.91 | 35.41% | 0.22% |
| CANADA | 33.40 | 42.05 | 25.87% | 0.94% |
| SWITZERLAND | 20.99 | 25.65 | 22.22% | 0.58% |
| SWEDEN | 34.45 | 31.72 | -7.93% | 0.71% |
| S. AFRICA | 30.87 | 33.17 | 7.44% | 0.75% |
| AUSTRIA | 26.99 | 23.44 | -13.16% | 0.53% |
| BELGIUM | 61.38 | 78.42 | 27.76% | 1.86% |
| JAPAN | 29.49 | 35.74 | 21.18% | 0.80% |
| PORTUGAL | 32.33 | 48.14 | 48.89% | 1.08% |
| CHINA | 95.54 | 139.78 | 46.30% | 2.48% |
| SINGAPORE | 12.73 | 16.50 | 29.60% | 0.37% |
| U.A.E. | 114.11 | 188.36 | 65.07% | 2.53% |
| INDONESIA | 19.07 | 17.29 | -9.35% | 0.39% |
| KOREA REP. | 36.73 | 47.32 | 28.84% | 1.06% |
| VIETNAM | 59.54 | 81.12 | 36.24% | 1.82% |
| SAUDI ARABIA | 25.68 | 31.96 | 24.49% | 0.72% |
| OTHERS | 464.33 | 568.56 | 22.45% | 12.77% |
| TOTAL | 3797.98 | 4450.61 | 17.18% | 100.00% |
| Source : DGCIS | ||||
Port-wise / Regionwise Export of Leather and Leather products during APRIL-NOVEMBER-2014 & APRIL-NOVEMBER-2013
| (Value in Million US$) | |||||
| Region | APRIL-NOV | Share in | APRIL-NOV | Share in | % Variation |
| 2013 | Total Export | 2014 | Total Export | ||
| Southern | 1170.63 | 30.82% | 1338.59 | 30.08% | 14.35% |
| Western | 836.83 | 22.03% | 950.72 | 21.36% | 13.61% |
| Eastern | 516.31 | 13.59% | 549.58 | 12.35% | 6.44% |
| Northern | 472.23 | 12.43% | 539.20 | 12.12% | 14.18% |
| Central | 112.74 | 2.97% | 176.46 | 3.96% | |
| Others | 689.24 | 18.15% | 896.05 | 20.13% | 30.01% |
| Total | 3797.98 | 100.00% | 4450.61 | 100.00% | 17.18% |
Note: This is purely based on port-wise compilation and does not reflect the accurate regional performance: Source: DGCI& S
4.0 Conclusion:
India’s export of leather and leather products increased to US$ 4450.61 mn as against the performance of US$ 3797.98 mn in the corresponding period of last year, recording a positive growth of 17.18%.
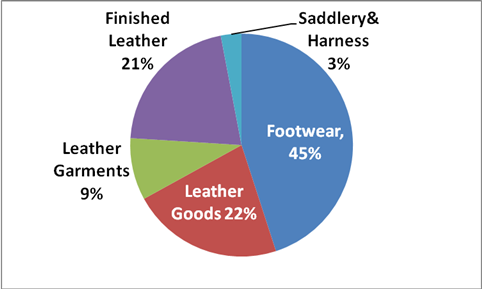
Export of different categories of Footwear alone holds a major share of 45% in India’s total leather & leather Products exports with an export value of US$ 2007.28 mn. This is followed by Leather Goods & Accessories with a share of 21.96%, finished leather 21.17%, leather garments 9.21% and saddlery & harness 2.57%.
Chart showing the Product wise Percentage Share in total exports