Analysis of Export Performance of Leather and Leather Products during Apr-Jul 2014 vis-à-vis Apr-Jul 2013
1.0 Introduction:
As per officially notified DGCI& S monthly export data, the export of Leather and Leather products for the period April-July 2014 touched US$ 2251.83 mn as against the performance of US$ 1858.92 mn in the corresponding period of last year, recording a positive growth of 21.14%. In rupee terms, the export touched Rs. 134800.79 million in April-July 2014 as against the previous year’s performance of Rs. 105753.38 million registering a positive growth of 27.47%.
A Statement showing the Product-wise Export performance during April-July 2014 vis-à-vis April-July 2013 is given below:
EXPORT OF LEATHER AND LEATHER PRODUCTS FROM INDIA
DURING APRIL-JULY 2014 VIS-A-VIS APRIL-JULY 2013
| (Value in Million Rs) | |||
| CATEGORY | APRIL-JULY | APRIL-JULY | % VARIATION |
| 2013 | 2014 | ||
| FINISHED LEATHER | 24252.59 | 29349.83 | 21.02% |
| LEATHER FOOTWEAR | 35151.66 | 46904.06 | 33.43% |
| FOOTWEAR COMPONENTS | 6257.68 | 7887.69 | 26.05% |
| LEATHER GARMENTS | 10135.79 | 12007.76 | 18.47% |
| LEATHER GOODS | 23950.31 | 28735.39 | 19.98% |
| SADDLERY AND HARNESS | 2587.10 | 3119.11 | 20.56% |
| NON-LEATHER FOOTWEAR | 3418.25 | 6796.95 | 98.84% |
| TOTAL | 105753.38 | 134800.79 | 27.47% |
| Source : DGCI &S | |||
| (Value in Million US$) | ||||
| CATEGORY | APRIL-JULY | APRIL-JULY | % VARIATION | % Share |
| 2013 | 2014 | |||
| FINISHED LEATHER | 426.31 | 490.29 | 15.01% | 21.77% |
| LEATHER FOOTWEAR | 617.89 | 783.53 | 26.81% | 34.80% |
| FOOTWEAR COMPONENTS | 110.00 | 131.76 | 19.79% | 5.85% |
| LEATHER GARMENTS | 178.17 | 200.59 | 12.59% | 8.91% |
| LEATHER GOODS | 420.99 | 480.02 | 14.02% | 21.32% |
| SADDLERY AND HARNESS | 45.48 | 52.10 | 14.58% | 2.31% |
| NON-LEATHER FOOTWEAR | 60.09 | 113.54 | 88.97% | 5.04% |
| TOTAL | 1858.92 | 2251.83 | 21.14% | 100.00% |
- In Rupee Terms, export of leather & leather products have shown positive growth in all the product segments during the first four months of the current financial year 2014-15.
- In Dollar Terms, export of leather & leather products have shown positive growth in all the product segments during the first four months of the current financial year 2014-15.
- Country-wise analysis/
- The major markets for Indian Leather & Leather Products are Germany with a share of 12.62%, U.K. 10.85%, USA 10.88%, Italy 8.62%, France 5.91%, Hong Kong 7.72%, Spain 5.18%, Netherlands 3.64%, China 3.09%, Denmark 1.23%, UAE.4.23%, Belgium 1.85%,
- These 12 countries together accounts for nearly 76% of India’s total leather& leather products export.
- Export of leather & leather products to major markets like Germany, USA, UK, Italy, France, Spain, Russia, Canada, Japan, Portugal, UAE, China have shown positive growth during April-July 2014.
Trend in India’s Export of Leather & Leather Products to different countries during April-July 2014 vis-à-vis April-July 2013:
| (VALUE IN MILLION US$) | ||||
| TOTAL | Share in | |||
| COUNTRY | APRIL-JULY | % change | total export | |
| 2013 | 2014 | 2014 | ||
| GERMANY | 235.50 | 284.17 | 20.66% | 12.62% |
| U.S.A. | 196.95 | 245.01 | 24.40% | 10.88% |
| U.K. | 203.68 | 244.31 | 19.95% | 10.85% |
| ITALY | 166.34 | 194.15 | 16.72% | 8.62% |
| FRANCE | 111.27 | 133.07 | 19.59% | 5.91% |
| HONG KONG | 178.74 | 173.79 | -2.77% | 7.72% |
| SPAIN | 87.71 | 116.69 | 33.04% | 5.18% |
| RUSSIA | 14.29 | 15.57 | 8.95% | 0.69% |
| NETHERLANDS | 70.69 | 82.07 | 16.10% | 3.64% |
| AUSTRALIA | 22.31 | 24.31 | 8.95% | 1.08% |
| NEWZEALAND | 2.82 | 3.45 | 22.30% | 0.15% |
| DENMARK | 27.47 | 27.81 | 1.23% | 1.23% |
| GREECE | 2.93 | 5.03 | 71.48% | 0.22% |
| CANADA | 14.44 | 20.44 | 41.55% | 0.91% |
| SWITZERLAND | 10.77 | 12.51 | 16.20% | 0.56% |
| SWEDEN | 18.19 | 16.72 | -8.08% | 0.74% |
| S. AFRICA | 16.22 | 15.43 | -4.86% | 0.69% |
| AUSTRIA | 13.49 | 12.11 | -10.22% | 0.54% |
| BELGIUM | 32.13 | 41.65 | 29.60% | 1.85% |
| JAPAN | 14.49 | 16.08 | 10.97% | 0.71% |
| PORTUGAL | 17.33 | 26.42 | 52.46% | 1.17% |
| CHINA | 41.02 | 69.64 | 69.76% | 3.09% |
| SINGAPORE | 5.89 | 9.86 | 67.31% | 0.44% |
| U.A.E. | 62.17 | 95.35 | 53.37% | 4.23% |
| INDONESIA | 9.46 | 7.53 | -20.41% | 0.33% |
| KOREA REP. | 17.75 | 21.16 | 19.25% | 0.94% |
| VIETNAM | 25.38 | 39.82 | 56.92% | 1.77% |
| SAUDI ARABIA | 14.38 | 16.21 | 12.76% | 0.72% |
| OTHERS | 225.11 | 281.49 | 25.05% | 12.50% |
| TOTAL | 1858.92 | 2251.83 | 21.14% | 100.00% |
| Source : DGCIS | ||||
3.0 Port-wise export performance
As per the Port-wise / Region-wise compilation for the period April-July 2014, export of leather & leather products from all the Regions have shown positive export trends
Port-wise / Regionwise Export of Leather and Leather products during
APRIL-JULY-2014 vis-a-vis APRIL-JULY-2013
TOTAL OF LEATHER AND LEATHER PRODUCTS
| (Value in Million US$) | |||||
| Region | APRIL-JULY | Share in | APRIL-JULY | Share in | % Variation |
| 2013 | Total Export | 2014 | Total Export | ||
| Southern | 569.68 | 30.65% | 690.13 | 30.65% | 21.14% |
| Western | 439.54 | 23.65% | 504.47 | 22.40% | 14.77% |
| Eastern | 249.08 | 13.40% | 277.86 | 12.34% | 11.55% |
| Northern | 205.54 | 11.06% | 242.73 | 10.78% | 18.10% |
| Central | 48.66 | 2.62% | 84.31 | 3.74% | 73.26% |
| Others | 346.43 | 18.64% | 452.35 | 20.09% | 30.58% |
| Total | 1858.92 | 100.00% | 2251.83 | 100.00% | 21.14% |
4.0 Conclusion:
India’s export of leather & leather products during the period year April-July 2014 touched US$ 2251.83 million as against US$ 1858.92 million in the corresponding period last year, recording a positive growth of 21.14%.
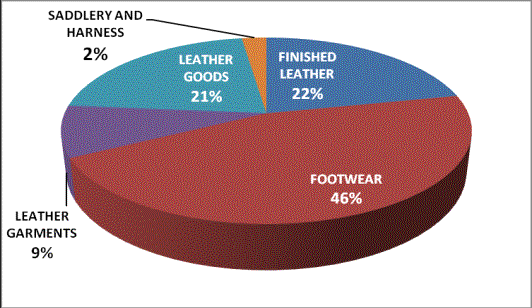
Export of different categories of Footwear alone holds a major share of 46% in India’s total leather & leather Products exports with an export value of US$ 1028.83 mn. This is followed by Leather Goods & Accessories with a share of 21%, finished leather 22%, leather garments 9% and saddlery & harness 2%.
Chart showing the product wise exports April-July 2014