Analysis of Export Performance of Leather and Leather Products April-January 2015 vis-à-vis April-January 2014
1.0 Introduction:
As per officially notified DGCI&S monthly export data, the export of Leather and Leather products for the financial year April-January 2015 touched US$ 5549.44 mn as against the performance of US$ 4892.39 mn in the corresponding period of last year, recording a positive growth of 13.43%. In rupee terms, the export touched Rs. 338092.10 million in April-January 2015 as against the previous year’s performance of Rs. 294891.20 million registering a positive growth of 14.65%.
A Statement showing the Product-wise Export performance during April-January 2015 vis-à-vis April-January 2014 is given below:
| (Value in Million US$) | ||||
| CATEGORY | AAPRIL-JAN | APRIL-JAN | % VARIATION | % Share |
| 2013-14 | 2014-15 | |||
| FINISHED LEATHER | 1059.08 | 1140.77 | 7.71% | 20.56% |
| LEATHER FOOTWEAR | 1662.94 | 1933.84 | 16.29% | 34.85% |
| FOOTWEAR COMPONENTS | 266.52 | 315.91 | 18.53% | 5.69% |
| LEATHER GARMENTS | 512.78 | 528.09 | 2.99% | 9.52% |
| LEATHER GOODS | 1117.51 | 1229.49 | 10.02% | 22.16% |
| SADDLERY AND HARNESS | 119.79 | 262.38 | 16.00% | 2.50% |
| NON-LEATHER FOOTWEAR | 153.77 | 221.00 | 70.63% | 4.73% |
| TOTAL | 4892.39 | 5549.44 | 13.43% | 100.00% |
| (Value in Million Rs) | |||
| CATEGORY | APRIL-JAN | APRIL-JAN | % VARIATION |
| 2013-14 | 2014-15 | ||
| FINISHED LEATHER | 63836.54 | 69499.90 | 8.87% |
| LEATHER FOOTWEAR | 100234.74 | 117816.33 | 17.54% |
| FOOTWEAR COMPONENTS | 16064.40 | 19246.58 | 19.81% |
| LEATHER GARMENTS | 30908.09 | 32173.24 | 4.09% |
| LEATHER GOODS | 67358.25 | 74904.73 | 11.20% |
| SADDLERY AND HARNESS | 7220.62 | 8465.89 | 17.25% |
| NON-LEATHER FOOTWEAR | 9268.56 | 15985.40 | 72.47% |
| TOTAL | 294891.20 | 269405.43 | 14.65% |
| Source: DGCI&S | |||
1.1 Major Highlights:
In Rupee Terms, export of leather & leather products have shown positive growth in all the product segments during the period April-January 2015.
In Dollar Terms, export of leather & leather products have shown positive growth in all the product segments during the period April-January 2015.
2.0 Country-wise analysis
share of 13.08%, U.K. 11.16%, USA 11.46%, Italy 8.75%, Hong Kong 8.03%, France 6.01%, Spain 5.14%, Netherlands 3.68%, China 2.59%, Denmark 1.53%, UAE.2.90%, Belgium 1.64%,
These 12 countries together accounts for nearly 76% of India’s total leather& leather products export.
Export of leather & leather products to major markets like Germany, USA, UK, Italy, France, Russia, Netherlands, Canada, S. Africa, Japan, Portugal, UAE, China have shown positive growth during April-January 2015. unts for nearly 76% of India’s total leather& leather products export.
Trend in India’s Export of Leather & Leather Products to different countries during April-Jan 2015 vis-à-vis April-Nov 2014 :
| (VALUE IN MILLION US$) | ||||
| TOTAL | Share in |
|||
| COUNTRY | APRIL-JAN | % change | Total export | |
| 2013-14 | 2014-15 | 2014 -15 | ||
| GERMANY | 639.82 | 700.40 | 9.47% | 12.62% |
| U.S.A. | 560.51 | 640.08 | 14.20% | 11.53% |
| U.K. | 545.95 | 639.53 | 17.14% | 11.52% |
| ITALY | 428.19 | 432.81 | 1.08% | 7.80% |
| FRANCE | 293.83 | 316.72 | 7.79% | 5.71% |
| HONG KONG | 392.73 | 361.78 | -7.88% | 6.52% |
| SPAIN | 251.58 | 301.56 | 19.87% | 5.43% |
| RUSSIA | 41.71 | 44.48 | 6.63% | 0.80% |
| NETHERLANDS | 180.01 | 197.02 | 26.97% | 3.55% |
| AUSTRALIA | 63.39 | 69.02 | 8.89% | 1.24% |
| NEWZEALAND | 7.63 | 9.69 | 29.29% | 0.17% |
| DENMARK | 74.77 | 72.29 | -3.32% | 1.30% |
| CANADA | 41.65 | 51.49 | 23.63% | 0.93% |
| SWITZERLAND | 27.13 | 32.54 | 19.93% | 0.59% |
| SWEDEN | 43.97 | 40.80 | -7.19% | 0.74% |
| S. AFRICA | 40.25 | 44.02 | 9.35% | 0.79% |
| AUSTRIA | 33.85 | 29.90 | -11.64% | 0.54% |
| BELGIUM | 80.00 | 97.71 | 22.14% | 1.76% |
| JAPAN | 39.11 | 45.56 | 16.49% | 0.82% |
| PORTUGAL | 41.88 | 58.60 | 39.91% | 1.06% |
| CHINA | 126.87 | 168.35 | 32.69% | 3.03% |
| SINGAPORE | 16.33 | 19.61 | 20.06% | 0.35% |
| U.A.E. | 141.82 | 232.98 | 64.28% | 4.20% |
| INDONESIA | 23.42 | 23.41 | -0.04% | 0.42% |
| KOREA REP. | 47.51 | 60.29 | 26.91% | 1.09% |
| FINLAND | 71.76 | 99.02 | 38.00% | 1.78% |
| SAUDI ARABIA | 31.84 | 39.30 | 23.46% | 0.71% |
| OTHERS | 604.89 | 720.50 | 19.11% | 12.98% |
| TOTAL | 4892.39 | 5549.44 | 13.43% | 100.00% |
| Source : DGCIS | ||||
Port-wise / Regionwise Export of Leather and Leather products during APRIL-JANUARY-2014-15 & APRIL-JANUARY-2013-14
| (Value in Million US$) | |||||
| Region | APRIL-JAN | Share in | APRIL-JAN | Share in | % Variation |
| 2013-14 | Total Export | 2014 | Total Export | ||
| Southern | 1480.25 | 30.26% | 1635.45 | 29.47% | 10.48% |
| Western | 1084.17 | 22.16% | 1234.22 | 22.24% | 13.84% |
| Eastern | 657.11 | 13.43% | 696.75 | 12.56% | 6.03% |
| Northern | 613.20 | 12.53% | 667.36 | 12.03% | 8.83% |
| Central | 159.59 | 3.26% | 204.32 | 3.68% | 28.03% |
| Others | 898.08 | 18.36% | 1111.35 | 20.03% | 23.75% |
| Total | 4892.39 | 100.00% | 4450.61 | 100.00% | 13.43% |
Note: This is purely based on port-wise compilation and does not reflect the accurate regional performance: Source: DGCI& S
4.0 Conclusion:
India’s export of leather and leather products increased to US$ 5549.44 mn as against the performance of US$ 4892.39 mn in the corresponding period of last year, recording a positive growth of 13.43%.
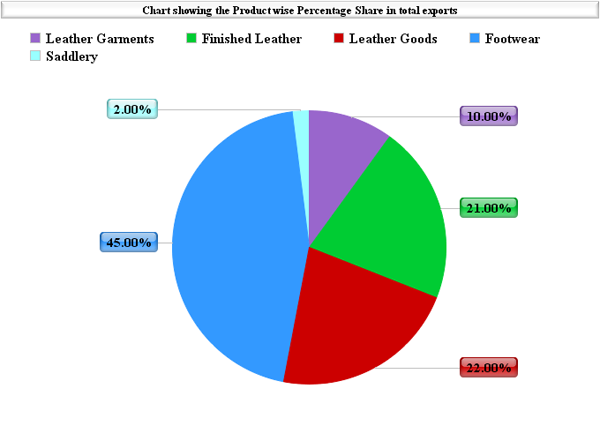
Export of different categories of Footwear alone holds a major share of 45.26% in India’s total leather & leather Products exports with an export value of US$ 2512.13 mn. This is followed by Leather Goods & Accessories with a share of 22.16%, finished leather 20.56%, leather garments 9.52% and saddlery & harness 2.50%.
Chart showing the Product wise Percentage Share in total exports